Rolling Correlation
This is a quick post, with a little code snippit I found useful. I'm a big Mathematica user and found that surprisingly, Mathematica doesn't have a function for rolling correlations on time series. For instance, suppose I have two daily stock prices and I want to see a 30d rolling window of how they're correlated - no function (that I could find exists).
RollingCorrelation[ts1_, ts2_, windowsize_] := TimeSeries[
  MapThread[
   Correlation[#1, #2] &, {
    Table[
     ts1["Values"][[n - windowsize ;; n]], {n, windowsize + 1,
      Length[ts1["Values"]]}],
    Table[
     ts2["Values"][[n - windowsize ;; n]], {n, windowsize + 1,
      Length[ts2["Values"]]}]
    }
   ], {ts1["Times"][[windowsize + 1 ;; Length[ts1["Times"]]]]}
  ]
Inputs into the function are two time series objects and the # of days you want this rollover. So if it's 30, at each point it will compute the correlation for the past 30 days.
Code in Use
Here's a quick example which does two stock prices:
yelp = TimeSeries[FinancialData["F", "2014-06-01"]]
twtr = TimeSeries[FinancialData["GM", "2014-06-01"]]
DateListPlot[RollingCorrelation[yelp, twtr, 28],
 PlotLabel -> "Ford vs GM 28d Rolling Correlations",
 Filling -> Axis]
Which gives us this chart
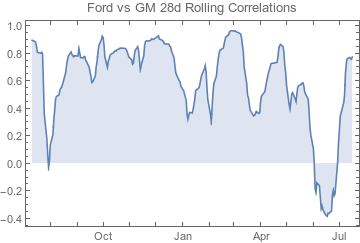
Interesting drop in Q2-3 2015 where the correlation flips on the two stocks.