The Problem
First, go read this article by Warren Sharp: The New England Patriots Prevention of Fumbles is Nearly Impossible. Sharp looks at the number of fumbles / total plays the Patriots had in 2010-14 and fits it to a Normal Distribution. He then argues that this is a statistical improbability (or perhaps it's the data scientist at nflproject.com) that does this.
For those not aware or reading this years from now - this is in regard to an event called Deflategate or as I know it "ballghazi". I'll let the reader decide which name is best.
Final note: I have no skin in this game - I am a lions fan / sufferer. Just a statistics nerd.
I claim the following: Fitting this data to a normal distribution is non-sense.
The Data
Download my data sets below, if you want to play around with it:
You should be able to roll that up to the aggregates.
If you find any issues, email me.
Normal Distribution is Wrong
Let's recall their claim: "Based on the assumption that fumbles per play follow a normal distribution, you’d expect to see, according to random fluctuation, the results that the Patriots have gotten over this period, once in 16,233.77 instances”
We can take a look at their data, which is all NFL teams 2010-2014 total number of lost fumbles divided by total number of plays. We can replicate Sharp's data with a plot that matches his and initially makes NE look really bad
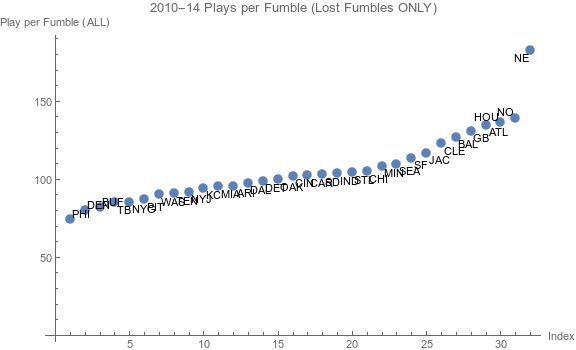
And a data table:
| Team | Games 2010-14 | Total Offensive Plays | Total LOST fumbles | Fumbles / Plays |
|---|---|---|---|---|
| NE | 80 | 5470. | 30. | 182.333 |
| NO | 80 | 5425. | 39. | 139.103 |
| HOU | 80 | 5316. | 39. | 136.308 |
| ATL | 80 | 5250. | 39. | 134.615 |
| GB | 80 | 5105. | 39. | 130.897 |
| BAL | 80 | 5207. | 41. | 127. |
| CLE | 80 | 5037. | 41. | 122.854 |
| JAC | 80 | 5023. | 43. | 116.814 |
| SF | 80 | 4877. | 43. | 113.419 |
| SEA | 80 | 4935. | 45. | 109.667 |
| MIN | 80 | 4984. | 46. | 108.348 |
| CHI | 80 | 4931. | 47. | 104.915 |
| STL | 80 | 4993. | 48. | 104.021 |
| IND | 80 | 5277. | 51. | 103.471 |
| SD | 80 | 5144. | 50. | 102.88 |
| CAR | 80 | 5008. | 49. | 102.204 |
| CIN | 80 | 5192. | 51. | 101.804 |
| OAK | 80 | 5081. | 51. | 99.627 |
| DET | 80 | 5429. | 55. | 98.709 |
| DAL | 80 | 5072. | 52. | 97.538 |
| ARI | 80 | 4972. | 52. | 95.615 |
| MIA | 80 | 5052. | 53. | 95.321 |
| KC | 80 | 5091. | 54. | 94.278 |
| NYJ | 80 | 5223. | 57. | 91.632 |
| TEN | 80 | 4799. | 53. | 90.547 |
| WAS | 80 | 5141. | 57. | 90.193 |
| PIT | 80 | 5122. | 59. | 86.814 |
| NYG | 80 | 5105. | 60. | 85.083 |
| TB | 80 | 4847. | 57. | 85.035 |
| BUF | 80 | 5065. | 62. | 81.694 |
| DEN | 80 | 5348. | 67. | 79.821 |
| PHI | 80 | 5335. | 72. | 74.097 |
So this looks bad. Let's checkout the histogram of plays per lost fumble, Sharp's metric.
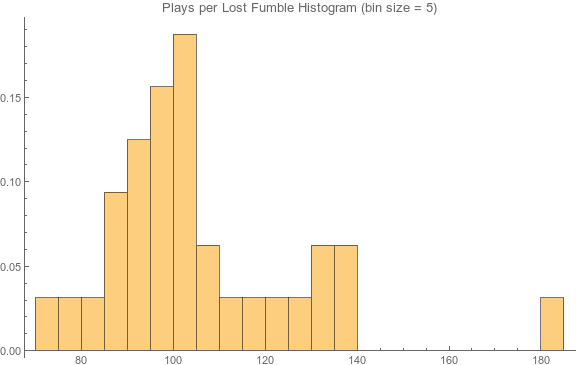
You can guess which bar is the Patriots. So at this point, their big claim (and the one that was repeated everywhere on blogs, etc):
"Based on the assumption that fumbles per play follow a normal distribution, you’d expect to see, according to random fluctuation, the results that the Patriots have gotten over this period, once in 16,233.77 instances”
Cool. So let's fit this to a normal distribution by taking the mean (103.365) and the standard deviation of this data set (17.2877) without the Patriots. Then, we can say, what the total density less than or equal to the Patriots value of 182.33:
Mean[Drop[fppWithLost[[All, 5]], 1]]
StandardDeviation[Drop[fppWithLost[[All, 5]], 1]]
AccountingForm[1 - CDF[NormalDistribution[103.365, 17.2877], 182.33]]

103.365
17.2877
0.00000246554
Apologies for the ugly Mathematica code.
We'll get 0.00000246554. Not an exact match but apprxomiately close to Sharps. Does this mean that the Patriots are at an impossible level? Well, let's eyeball that histogram with this distribution overlaid:

Huh. Doesn't really look like a great fit. Maybe it's the bin size we're using on the histogram?
Oh. Well, we can do a test of normality Kolmogorov Smirnov:
DistributionFitTest[fppWithLost[[All, 5]], Automatic,
  "HypothesisTestData"]["TestDataTable", "KolmogorovSmirnov"]

Statistic P-Value
Kolmogorov-Smirnov  0.173157  0.0163527
p-value is pretty small, looks like we can reject the null hypothesis (that the hypothesized normal and the observed values are drawn from the same distribution). Looks like we can't use normal and I'd reject the assumption that fumbles per play follow a normal distribution.
Rant Even if you don't trust the above frequentist test - using a normal distribution here should give you some concerns.
- It makes a lot of assumptions about tails - especially with values less than zero.
- 31 (32 - NE) samples doesn't strike me as enough to really build up a comprehensive distribution.
In fact, I tried a few other distributions (Poisson, in particular) and nothing is a great fit. However, this is a great case for bootstrapping. In another post I'm writing now, I'm going to claim the odds of the Patriots plays/fumble number is closer to 10% - unspectacular and not a convincing case for cheating.