The Data
So, you can download the data for yourself - it's 2001-2012 regular season and preseason outcomes data. I did some basic QA on it to make sure the totals match and picked random records and they look okay.
Wins
First question is - does winning a preseason game matter? Do teams that win more preseason games also tend to win more regular season games? Well, we can look at a quick table:
    record counts mean_regular_season_wins sd_reg_wins
       0-4     24                 7.416667    2.827146
       1-3     84                 7.142857    3.062178
       2-2    133                 8.578947    3.067944
       3-1     91                 8.098901    2.902317
       4-0     20                 7.850000    3.616847
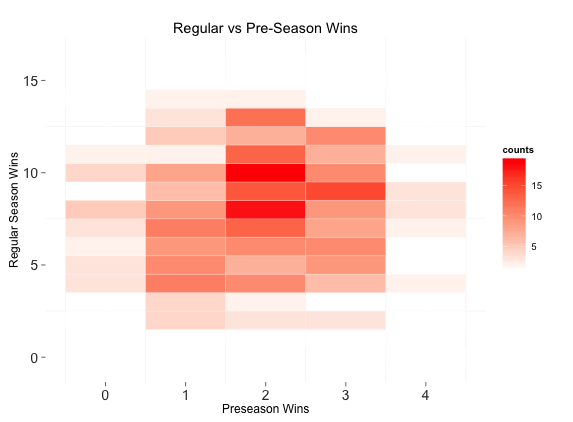
Well, that's nice. It's nicely approximately normally distributed too, at least in terms of counts. An interesting observation here - teams that go 2-2 tend to have more regular season wins but given how big the standard deviations are (about three games), the effect seems weak ($\rho = 0.095$ but not statistically signifiant). We can also look at a cool grid that helps reveal there is not really a pattern:

Points For (Number of Points Scored)
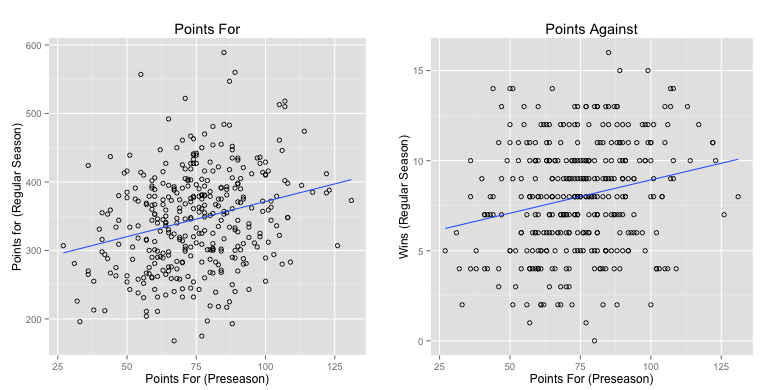
OK. So the data says that winning in the preseason doesn't seem to be an indicator of regular season outcomes. What about points? Can pre-season point totals tell us anything about regular season performance? We can look at a quick plot, with points-for in the preseason on the x-axis and see how it affects regular season points and wins. I've overlaid the basic regression plot

Interesting - there does appear to be a weak effect here, we can do a quick regression on the two variables:
Call:
lm(formula = s$wins ~ s$pre_points_for)

Residuals:
    Min      1Q  Median      3Q     Max
-8.1923 -2.1760  0.0662  2.1039  7.6231

Coefficients:
                 Estimate Std. Error t value Pr(>|t|)
(Intercept)       5.23781    0.67619   7.746 1.03e-13 ***
s$pre_points_for  0.03693    0.00881   4.192 3.51e-05 ***
---
Signif. codes:  0 ‘***’ 0.001 ‘**’ 0.01 ‘*’ 0.05 ‘.’ 0.1 ‘ ’ 1

Residual standard error: 3.009 on 350 degrees of freedom
Multiple R-squared: 0.04781,  Adjusted R-squared: 0.04509
F-statistic: 17.57 on 1 and 350 DF,  p-value: 3.507e-05
We can add in points against:
Call:
lm(formula = s$wins ~ s$pre_points_for + s$pre_points_against)

Residuals:
    Min      1Q  Median      3Q     Max
-8.8732 -2.2898  0.0999  2.1209  7.5394

Coefficients:
                      Estimate Std. Error t value Pr(>|t|)
(Intercept)           6.440869   0.938583   6.862  3.1e-11 ***
s$pre_points_for      0.036810   0.008780   4.192  3.5e-05 ***
s$pre_points_against -0.016014   0.008696  -1.841   0.0664 .
---
Signif. codes:  0 ‘***’ 0.001 ‘**’ 0.01 ‘*’ 0.05 ‘.’ 0.1 ‘ ’ 1

Residual standard error: 2.998 on 349 degrees of freedom
Multiple R-squared: 0.05697,  Adjusted R-squared: 0.05156
F-statistic: 10.54 on 2 and 349 DF,  p-value: 3.587e-05
This tells us: it is a little predictive (and statistically significant) but our $R^2$ is horrible and our confidence intervals are equally disappointing. You do want your team to score more points in the pre-season: teams that put up a lot of preseason points tend to do better in the regular season. The effect is very weak, though, and probably more correlated to some other confounding variables (such as specific player outcomes).
However, I still don't see any convincing reason to root for your team to win or lose - the data doesn't seem to indicate that pre-season game outcomes are predictive of any regular season outcome.